Problem 13.1 A Spider and a Well
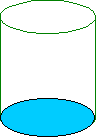
A spider is at the bottom of a well. Each morning she spins a web
to ascend 2 m up the well's wall, and then during the day she slips 1 m
down the wall. If the well is 10 m deep, how long will it take for
the spider to get out of the well?

You must justify your answer by using diagram(s) and/or tables.
Problem 13.2 Lockers
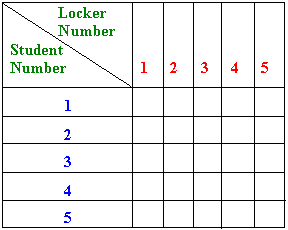
A school in a certain remote area has five lockers that are numbered 1,
2, 3, 4 and 5. On the first day of the first term, the first student on
the roll runs through the corridor and opens every locker. The second
student shuts every second locker, the third student changes every third
locker (i.e. opens it if it is shut, shuts it if it is open), the fourth
student changes every fourth locker, and the fifth student changes every fifth locker.

a. Which of the lockers are left open?
b. Extend the question stated in part (a) to:
(i) 10 lockers and 10 students
(ii) 20 lockers and 20 students
(iii) 30 lockers and 30 students
(iv) 50 lockers and 50 students
(v) 101 lockers and 101 students
(vi) 1000 lockers and 1000 students
Is there a pattern between the number of students and the number of
open lockers?
Generalise the above result assuming that there are n students.
Problem 13.3 Finite Difference Table


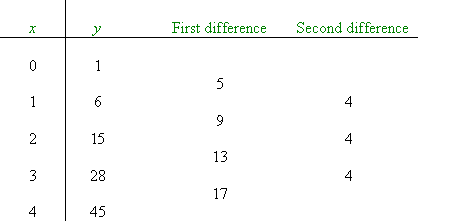
From the table we can infer that:
- For any quadratic function, the second difference in a finite
difference table is always constant.
- A finite difference table enables us to find a rule for the
quadratic function.
Example
Find a rule for the function specified by the following table of
values:

Solution:


Note:
A finite difference table must include x = 0. So, the
value of c can be determined.
Using a Graphics Calculator
Clear any lists within the STAT menu (and
if there are graphs in memory, clear them using the Y = menu). Select EDIT from
the STAT menu and enter x values under
L1 and y values under L2. Both
lists should have the same number of entries.
Select Plot 1 on from the STAT
PLOT menu and turn the other plots off. Highlight the second plot
type that gives a line graph. Choose L1 for the Xlist and L2 for the Ylist (if they are not already highlighted).
Choose Zoom Stat from the ZOOM menu to obtain the graph of the data, which is a parabola. Then
choose Quad Reg in the CALC section of the STAT menu. The screen
display shows that the relation

fits the data.
Question
Find a rule for the quadratic function specified by each of the
following tables and check your answers with a graphics calculator.
|