We use statistics such as the mean, median and mode to obtain information about a population from our sample set of observed values.
Mean
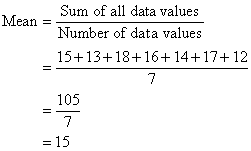
The mean (or average) of a set of data values is the sum of all of
the data values divided by the number of data values. That is:

Example 1
The marks of seven students in a mathematics test with a maximum possible
mark of 20 are given below:
15
13 18
16 14
17 12
Find the mean of this set of data values.
Solution:

So, the mean mark is 15.
Symbolically, we can set out the solution as follows:

So, the mean mark is 15.
Median
The median of a set of data values is the middle value of the data
set when it has been arranged in ascending order. That is, from the
smallest value to the highest value.
Example 2
The marks of nine students in a geography test that had a maximum
possible mark of 50 are given below:
47
35 37
32 38
39 36
34 35
Find the median of this set of data values.
Solution:
Arrange the data values in order from the lowest value to the highest
value:
32
34 35
35 36
37 38
39 47
The fifth data value, 36, is the middle value in this arrangement.

Note:

In general:

If the number of values in the data set is even, then the median is
the average of the two middle values.
Example 3
Find the median of the following data set:
12
18 16
21 10
13 17 19
Solution:
Arrange the data values in order from the lowest value to the highest
value:
10
12 13
16 17
18 19 21
The number of values in the data set is 8, which is even. So, the
median is the average of the two middle values.

Alternative way:
There are 8 values in the data set.

The fourth and fifth scores, 16 and 17, are in the middle. That is,
there is no one middle value.

Note:
- Half of the values in the data set lie below the median
and half lie above the median.
- The median is the most commonly quoted figure used to
measure property prices. The use of the median avoids the problem of
the mean property price which is affected by a few expensive properties that
are not representative of the general property market.
Mode
The mode of a set of data values is the value(s) that occurs most
often.
The mode has applications in printing. For example, it is important
to print more of the most popular books; because printing different books in
equal numbers would cause a shortage of some books and an oversupply of
others.
Likewise, the mode has applications in manufacturing. For example, it is
important to manufacture more of the most popular shoes; because
manufacturing different shoes in equal numbers would cause a shortage of
some shoes and an oversupply of others.
Example 4
Find the mode of the following data set:
48 44
48 45 42
49 48
Solution:
The mode is 48 since it occurs most often.
Note:
- It is possible for a set of data values to have more than one
mode.
- If there are two data values that occur most frequently, we
say that the set of data values is bimodal.
- If there is no data value or data values that occur most
frequently, we say that the set of data values has no mode.
Analysing Data
The mean, median and mode of a data set are collectively known as measures
of central tendency as these three measures focus on where the data is
centred or clustered. To analyse data using the mean, median and mode, we
need to use the most appropriate measure of central tendency. The following
points should be remembered:
- The mean is useful for predicting future results when there are no
extreme values in the data set. However, the impact of extreme values on
the mean may be important and should be considered. E.g. The impact of a
stock market crash on average investment returns.
- The median may be more useful than the mean when there are extreme
values in the data set as it is not affected by the extreme values.
- The mode is useful when the most common item, characteristic or value
of a data set is required.
Key Terms
statistics, mean, average, median, mode, measures
of central tendency |