The frequency of a particular data value is the
number of times the data value occurs.
For example, if four students have a score of 80 in
mathematics, and then the score of 80 is said to have a frequency of
4. The frequency of a data value is often represented by f.
A frequency table is constructed by arranging collected data values
in ascending order of magnitude with their corresponding frequencies.
Example 5
The marks awarded for an assignment set for a Year 8 class
of 20 students were as follows:
6 7
5 7
7 8
7 6
9 7
4 10
6 8
8 9
5 6
4 8
Present this information in a frequency table.
Solution:
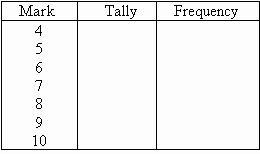
To construct a frequency table, we proceed as follows:
Step 1:
Construct a table with three columns. The first column
shows what is being arranged in ascending order (i.e. the marks). The
lowest mark is 4. So, start from 4 in the first column as shown below.
Step 2:
Go through the list of marks. The first mark in the
list is 6, so put a tally mark against 6 in the second column. The
second mark in the list is 7, so put a tally mark against 7 in the second
column. The third mark in the list is 5, so put a tally mark against 5
in the third column as shown below.
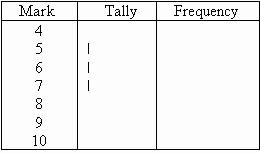
We continue this process until all marks in the list are
tallied.
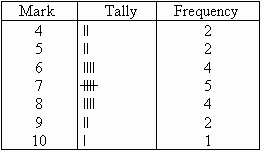
Step 3:
Count the number of tally marks for each mark and write it
in third column. The finished frequency table is as follows:
In general:
We use the following steps to construct a frequency table:
Step 1:
Construct a table with three columns. Then in the
first column, write down all of the data values in ascending order of magnitude.
Step 2:
To complete the second column, go through the list of data
values and place one tally mark at the appropriate place in the second
column for every data value. When the fifth tally is reached for a
mark, draw a horizontal line through the first four tally marks as shown for
7 in the above frequency table. We continue this process until all
data values in the list are tallied.
Step 3:
Count the number of tally marks for each data value and
write it in the third column.
Class Intervals (or Groups)
When the set of data values are spread out, it is difficult
to set up a frequency table for every data value as there will be too many
rows in the table. So we group the data into class intervals (or groups) to help us organise, interpret and analyse the data.
Ideally, we should have between five and ten rows in a
frequency table. Bear this in mind when deciding the size of the class
interval (or group).
Each group starts at a data value that is a multiple of that
group. For example, if the size of the group is 5, then the groups
should start at 5, 10, 15, 20 etc. Likewise, if the size of the group
is 10, then the groups should start at 10, 20, 30, 40 etc.
The frequency of a group (or class interval) is the number of data values that fall in the range
specified by that group (or class interval).
Example 6
The number of calls from motorists per day for roadside
service was recorded for the month of December 2003. The results were as
follows:

Set up a frequency table for this set of data values.
Solution:
To construct a frequency table, we proceed as follows:
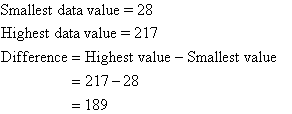

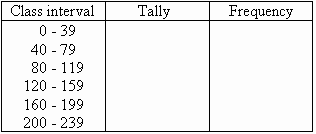
Step 1: Construct a table with three columns, and then write
the data groups or class intervals in the first column. The size of each
group is 40. So, the groups will start at 0, 40, 80, 120, 160 and 200 to
include all of the data. Note that in fact we need 6 groups (1 more than we
first thought).
Step 2: Go through the list of data values. For the first
data value in the list, 28, place a tally mark against the group 0-39 in
the second column. For the second data value in the list, 122, place a tally
mark against the group 120-159 in the second column. For the third data
value in the list, 217, place a tally mark against the group 200-239 in
the second column.
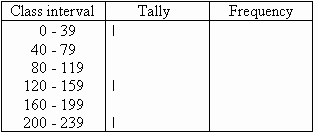
We continue this process until all of the data values in the set
are tallied.
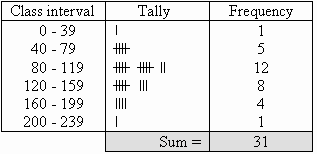
Step 3: Count the number of tally marks for each group and
write it in the third column. The finished frequency table is as follows:
Key Terms
frequency, frequency table, class intervals, group |