An exponential relation has the form

where the base number, a, is a positive real number other than 1 and the variable x is the exponent of the base number.
Exponential Graphs

Example 16

Solution:
a.

b.
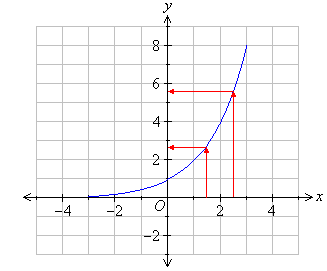

Note that the value of y increases rapidly as the value of x increases. This is called exponential growth.
Example 17

Solution:
a.

b.
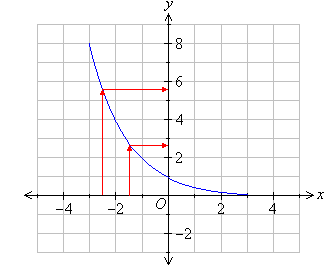

Note that the value of y decreases rapidly as the value of x increases. This is called exponential decay.
Using a Graphics Calculator


Press TABLE to obtain the following screen
display.


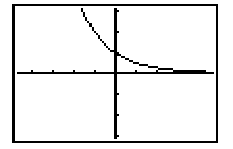

Press TABLE to obtain the following screen
display.

Domain of an Exponential Function
The domain of a function is the set of all first elements (x values) of the function's ordered pairs.
It is clear from the graphs of exponential functions that x can
take any value. So, the domain of an exponential function = R (i.e.
the set of all real numbers).
Range of an Exponential Function
The range of a function is the set of all second elements (y values) of the function's ordered pairs.
It is clear from the graphs of exponential functions that y >
0 for all values of x. So, the range of an exponential function = R + (i.e. the set of all positive real numbers).
Example 18
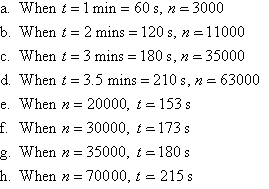
The population growth over time (measured in seconds) of a particular
bacteria is displayed in the following graph.
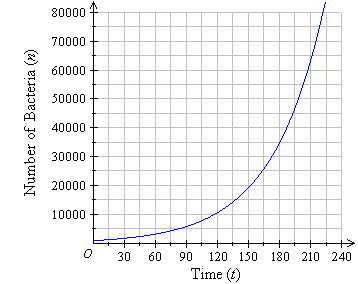
a. How many bacteria are alive after 1 minute?
b. How many bacteria are alive after 2 minutes?
c. How many bacteria are alive after 3 minutes?
d. How many bacteria are alive after 3.5 minutes?
e. How long did it take the population of bacteria to reach 20000?
f. How long did it take the population of bacteria to reach
30000?
g. How long did it take the population of bacteria to reach 35000?
h. How long did it take the population of bacteria to reach 70000?
Solution:
Example 19
The graph below shows how an investment has grown exponentially over a
30-year period.
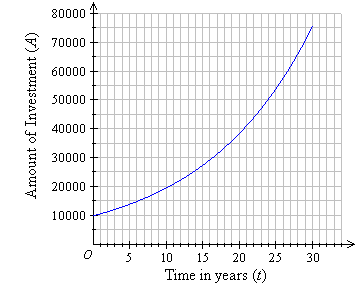
a. What is the initial investment?
b. How long did it take for the investment value to grow to $20000?
c. How long did it take for the investment value to grow to $30000?
d. How long did it take for the investment value to grow to $50000?
e. What is the value of the investment after 30 years?
f. Which of the following exponential relations best describes
the graph?

Solution:

Key Terms
exponential relation, exponent, exponential graph, exponential
growth, exponential decay, domain
of an exponential function, range of an exponential
function |